 Australians love social media - that much is clear - but if you've ever wondered what sites have the highest membership per state or why consumers follow certain brands on Twitter and Facebook over others, then this infographic is for you.
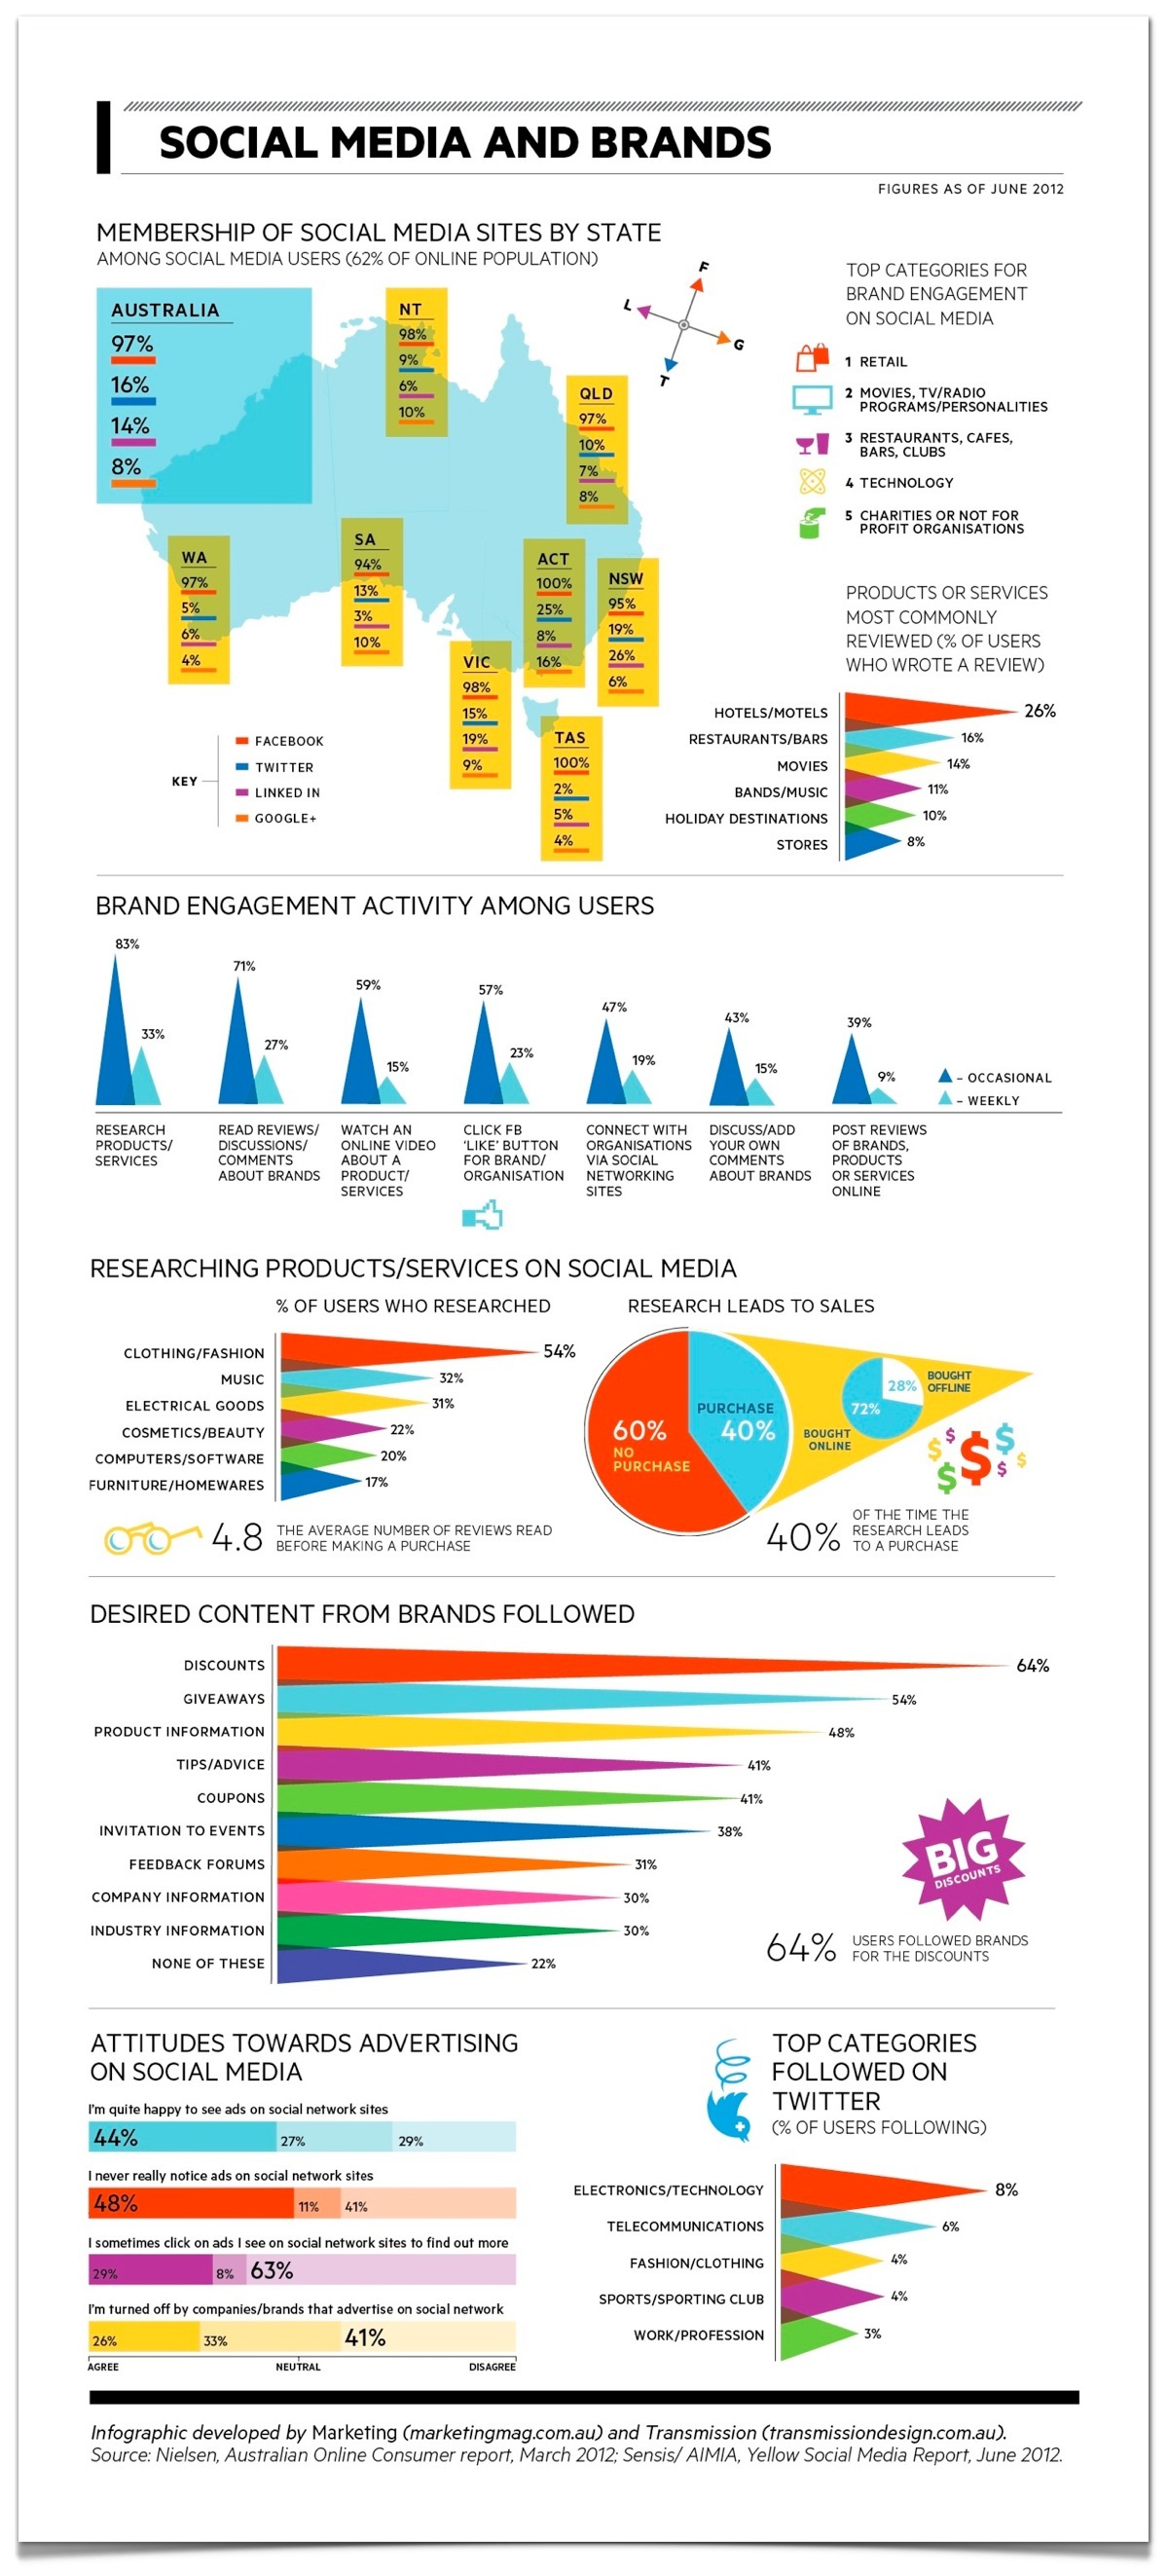
Developed by Marketing magazine and Transmission Design, the infographic looks at the way consumers use social media and what they want from brands. It uses figures from Nielsen's 'Australian Online Consumer Report' and the results show some interesting stats for how retailers should be using their social media.
When it comes to brand engagement, it seems the top two reasons that consumers take to the internet is to research products and services and to read reviews and discussions about brands. Surprisingly, the least common reason behind users heading online was to post reviews of brands, products or services. But amongst those who do enjoy sharing their thoughts, hotels and motels came clearly out in front as the industry most commonly reviewed.
It also seems that only 40% of research by consumers online actually leads to a sale, with consumers typically reading five reviews before making a purchase. Clothing and fashion reigned supreme as the industry most researched online, with music and electrical goods coming in second and third.
If you've ever wondered why users follow brands on social media, the answer is unarguable - they are looking for discounts - something Econsultancy's own research also recently demonstrated.
Within the Marketing Magazine / Transmission infographic, 64% of users said they follow brands in the hopes of finding out about discounts and 54% and 48% said they were looking for giveaways and product information.
Facebook is still clearly the most popular social media site in Australia, with 97% of online users reporting membership to the site. Twitter holds second place, but is significantly further behind, securing membership from only 16% of users.
LinkedIn and Google+ followed in third and fourth place with 14% and 8% respectively.
The infographic also shows that usage patterns of the social media sites varies significantly per state. LinkedIn is more popular in NSW and VIC, pulling in 26% and 19% membership, but has only a 3% membership in SA. Twitter has a membership of about one in five in NSW and the ACT but only 2% of Tasmanians are members of the site. And similarly, Google+ proved popular in ACT but showed low levels of usage in all other states.
No hay comentarios:
Publicar un comentario