
We've been investigating how and when the free version of Google Analytics uses data sampling to give you information on what's happening on your website, and what that means for your data.
My colleague Adam put together his thoughts on the matter and I wanted to share these with you here.
Briefly, Google Analytics uses sampling in much the same way a research company does – to make assumptions about your site based on a sample of activity.
It only does this once the traffic on your site gets to a certain volume (around the million mark), or if you start changing the standard reports (creating segments, custom reports or secondary dimensions).
Mostly it does it for practical reasons: it takes an enormous amount of time and power to process high volumes of data, so analysing a sample that will still give you a true indication of what's going on within your site is a good solution.
The way Google Analytics samples works well for most sites. If you have a fairly straightforward site with a relatively small number of sources, and regular flow of traffic, then Google Analytics reports will give you a very accurate picture of your site's performance. That's probably enough for a smaller site.
For very big sites however, especially those that have a lot of rapidly rotating content and an elaborate traffic profile, the sampling methods that standard GA uses may not be adequate when you start to use segments, custom reports and secondary dimensions, and can start to throw up some inaccurate results.
We pulled the data from one of our larger e-commerce clients to demonstrate how big a problem this can be (data has been anonymised).
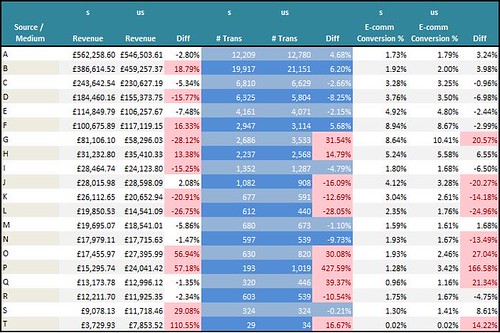
The 's' columns show you the results from the sampled report, the 'us' columns show you the results when that same report was unsampled. The really interesting parts are the % difference columns. Those tell you the percentage by which the sampled reports were off.
Have a quick look, and you can see that the sampling is doing a reasonable job for some traffic sources, but with others it's all over the place.
If you're playing around with Google Analytics and you notice that you're having results change as above when you start to customise reports, that's often a pretty good sign that you're experiencing the effects of heavy sampling in your account.
If Google Analytics ever needs to sample, there will be a yellow box in the top right of your Google Analytics report telling you so (it'll say something like 'this report is based on 249385 visit, 13.46% of visits').
If the percentage sampled is lower than 15%, it could be too small to give you a true picture of what's happening on your site. You can change the size of the sample (but there's still an upper limit on the free Google Analytics).
In some ways, sampling is a nice problem to have – it means that your site is seeing high volumes of traffic. But if you need a more accurate picture there are two basic things you can do to improve the accuracy of your reports: invest in an industrial strength analytics package (like Google Analytics Premium) or use one of these workarounds:
- Use only standard reports. GA doesn't start to sample until you modify reports with segments, secondary dimensions, or use custom reporting, so if you can get away with only using standard reports, go for it.
- If you need to look at just a slice of your data, create a filtered profile (for example, to show 'email only' traffic). This will show you unsampled data. But of course, you will need to pre-empt your need and set the profile up proactively.
- If your traffic is fairly consistent, try looking at a smaller date range. The smaller the range, the more data within that range will be analysed. But be careful that you don't pick such a small range that you miss things like seasonal trends. You can use this method to pull the data out into a spreadsheet and piece the data from multiple periods together, though you'll still need to be careful with this because you'll need to recalculate calculated metrics and your unique visitor counts won't add up properly.
If none of those things work for you, you should probably upgrade to something like Google Analytics Premium. The most common reason among our clients for using Google Analytics Premium is to get more accurate data for big or complex sites (particularly e-commerce companies).
It gives you faster data processing (in practical terms you get reports every four hours instead of every 24), and has a data sampling limit of around 200 times higher that of Google Analytics (at the moment – that's likely to increase), enough for a large ecommerce site.
Google Analytics is a great tool for small to medium websites and even many large sites operating in very stable environments, but a paid tool will give you the flexibility and speed required to gain a more accurate view of a site with heavier-volume data in fast-moving markets.
Ben Gott is Head of Web Analytics at Periscopix and a guest blogger on Econsultancy.
No hay comentarios:
Publicar un comentario